
On 25 August 2026 a new star flared up in the small constellation of Sagitta, the Arrow: Nova Sagittae 2026, now catalogued as V0488 Sge. The alert reached me by email the same day as an Astronomer’s Telegram, and that evening I already had the nova in my images. It was at about magnitude 7.0, close to its peak. Since then I have measured its brightness in the V band from Alexandria, at first on every clear night and since October every two to three nights.
The light curve below shows all of my measurements, together with a few published values for comparison. It updates automatically as new data come in.
Discovery and maximum
The nova was discovered on 25 August 2026 at 03:04 UT by the NMW-TexasTech survey, a camera with a 135 mm telephoto lens that automatically scans the sky for new objects. At that time the nova was at unfiltered magnitude 9.0 and still brightening. At the same position, the Gaia catalogue lists a variable star of magnitude 19 to 21. The brightness therefore rose by more than 10 magnitudes, a factor of more than ten thousand.
The nova reached its maximum on the evening of 25th August at about 21 UT at around magnitude 6.9, measured with the 1.22 m Galileo telescope at Asiago. My own value of about 7.0 from the same evening fits well. That was too faint for the naked eye, but an easy target in binoculars.
A very fast nova
Astronomers describe how quickly a nova fades with two numbers: t2 and t3, the time it takes to drop 2 or 3 magnitudes below maximum. For V0488 Sge these were only 4 days (t2) and 7 days (t3), which makes it a “very fast” nova. Both thresholds are marked as dashed lines in the light curve.
The spectrum changed just as quickly. On 25 August it still showed many absorption lines and P Cygni profiles, typical of a nova shortly before maximum. Within hours, emission lines of singly ionised iron appeared, which makes V0488 Sge an Fe II-type nova. Only four days later, on 29 August, it had already reached the nebular phase. The line widths show that the ejected gas is streaming outwards at up to about 3000 km/s, and not evenly in all directions, but in a non-spherical shell.
From 7 September lines of neutral helium appeared, and from 13 September also ionised helium (He II). At the same time, forbidden nitrogen lines ([N II]) showed that the shell of ejected gas is becoming transparent. The NuSTAR X-ray telescope also detected the nova at the end of August: it sees gas at around 80 million degrees, heated by shock waves inside the shell.
What my light curve shows
From about magnitude 7.0 on 25 August, the nova faded to 13.4 by 17 November, about six and a half magnitudes in twelve weeks. The decline keeps slowing down:
| Period | Decline per day |
|---|---|
| 29 Aug–4 Sep | 0.22 mag |
| 5–11 Sep | 0.13 mag |
| 12–25 Sep | 0.06 mag |
| 26 Sep–2 Oct | 0.04 mag |
| 3–11 Oct | 0.04 mag |
| 12 Oct–17 Nov | 0.02 mag |
Notably, the decline slows down at about the time when the helium lines strengthen in the spectra and the shell becomes transparent. Whether this is more than a coincidence in time, I cannot tell from my data alone.
I also see a few small irregularities in the decline. On 16 September the nova stayed at the brightness of the previous night instead of fading by the expected 0.06 mag, and on 18 September it was 0.04 mag brighter than on the 17th, about two and a half times the combined measurement error. Short fluctuations like these are not unusual for novae on their way down, but single nights are not proof.
Since the end of October the nova has been fading by only about 0.02 mag per day. If the decline keeps slowing down the way it has so far, the nova will reach magnitude 14 around early January.
How good are the measurements?
I observe with a 60 mm refractor (488 mm focal length), a monochrome camera with an IMX178 sensor and a V filter. The nova is measured relative to three comparison stars of known brightness from the AAVSO database (differential photometry). A fourth star, the check star 000-BJT-096, runs along as a test. Over 66 measurements its average agrees with the catalogue value to within 0.001 mag, with a scatter of 0.008 mag.
The best comparison comes from the University Observatory Jena, which measured the nova photometrically on 1 and 2 September. My values are from the same evenings, a few hours earlier. Allowing for the fading in between, my measurements predict 9.70 and 9.91 for Jena’s times. Jena measured 0.08 and 0.03 mag brighter. Both differences are compatible with Jena’s uncertainty of ±0.05 mag; the larger one is about one and a half times that value.
| Date | Jena Observatory | My measurement | Expected at Jena’s time |
|---|---|---|---|
| 1 Sep | 9.62 ± 0.05 (22:13 UT) | 9.661 ± 0.016 (18:51 UT) | ≈ 9.70 |
| 2 Sep | 9.88 ± 0.05 (20:34 UT) | 9.903 ± 0.011 (18:19 UT) | ≈ 9.91 |
For a 60 mm telescope under a bright city sky, that is a good result.
There are limits, too. The first three values (25, 26 and 28 August) are only quick measurements: at magnitude 7 to 8 there were not enough suitable comparison stars in the field, so I compared the nova with the brightest available star (V = 7.72). These values show the trend but carry no formal uncertainty. The data are not colour-transformed; because the colours of the nova and the comparison stars are almost the same here, the correction amounts to less than 0.001 mag.
In early October strong [O III] emission was reported (ATel #18090). Since then a good part of the light in the V band comes from a few bright emission lines. Measurements by different observers can then differ by a few hundredths of a magnitude or more, simply because their V filters are not exactly alike.
The later measurements of a night were taken at lower altitude (airmass up to 1.9) and scatter a little more. From October, the observing window after dark also gets shorter. On 26 September the three values of the night spread by almost 0.1 mag while the check star stayed constant. Thin passing clouds are the most likely cause, so the light curve shows the average of the night with a correspondingly larger error bar.
A faint neighbor star
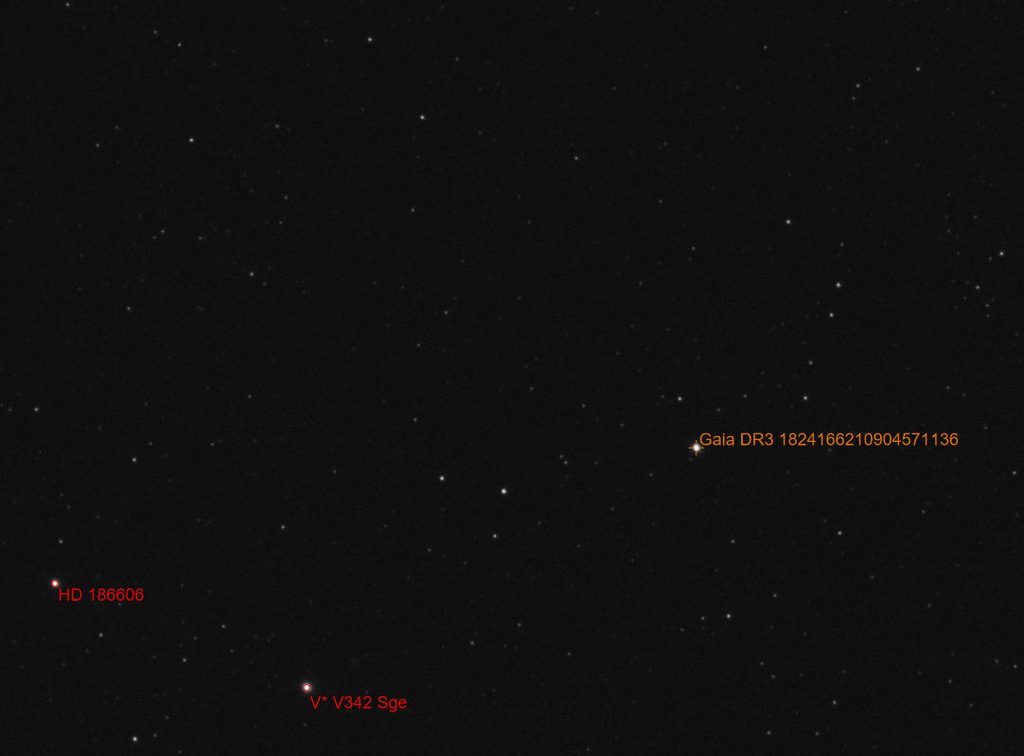
Only about 5″ from the nova sit two fainter stars: one of magnitude 14.7 to the southwest (Gaia DR3 1824166210895371904 and Gaia DR3 1824166210895375232). One of magnitude 16.5 to the west, right at the limit of what my stacked images show. With my setup one pixel covers about one arc second, so their light merges with that of the nova. Around maximum this did not matter: together they added well under one percent to the light of the nova. As the nova fades, however, their share grows. By mid-November about a quarter of the measured light came from these two neighbors.
My first evaluation in AstroImageJ measured the nova and its neighbors together in a small aperture. As a result the nova looked too bright from October onwards, by up to 0.1 mag. In September the effect went the other way: the small aperture missed part of the nova’s light, which my refractor spreads a little wider than the light of normal stars because of the nova’s unusual spectrum. Those values came out 0.02 to 0.03 mag too faint.
I have therefore re-measured all images with my own evaluation. From the comparison stars in each stacked image I build a model of a star image. With it I determine the position and brightness of the neighbor light from the images in which it is clearly visible and subtract it before measuring the nova in a larger aperture. The fit treats both neighbors as one star and finds V = 14.53 ± 0.03 at 5.2″ southwest.
Afterwards I checked this against the Gaia Collaboration, Vallenari et al. 2023 catalog. Its brighter neighbor star sits within 0.2″ of my fitted position, and converted from Gaia magnitudes to V, the two stars together come to 14.52 mag. Both lie well inside my measuring aperture, so subtracting their light as one star removes almost exactly what they contribute. A second test: after the subtraction the result depends much less on the aperture size than before. The light curve on this page now shows these corrected values throughout.
The effect also shows up in the data of other observers. Up to 18 November the AAVSO International Database holds about 6,700 V measurements of V0488 Sge from 51 other observers. In the first week after maximum their median agrees with my corrected curve to within 0.01 mag. After that the others come out brighter, and the gap grows as the nova fades: about 0.09 mag three weeks after maximum, 0.21 mag after six weeks and 0.29 mag in mid-November. If the neighbors are included in the measurement, I expect 0.06, 0.17 and 0.30 mag. Most observers therefore measure the nova together with its neighbors, as I did in my first evaluation. A few observers whose offset hardly changes probably use smaller apertures. Individual observers also differ from each other by 0.1 to 0.2 mag, which is common for a nova in this phase.
What comes next
I will keep observing V0488 Sge as long as it makes sense. On 17 November the nova was at magnitude 13.4. For this I now stack exposures of a full hour (60 × 60 s or 30 × 120 s), and even then the error bar is about 0.04 mag. Sagitta also sets earlier every evening, so I expect to follow the nova until around the turn of the year.
The exciting question remains whether the nova will show up as a “supersoft” X-ray source: the moment when the shell is transparent enough to see the hot surface of the white dwarf directly in X-rays.
Sources
- Discovery: ATel #18009 (Texas Tech University)
- First spectra and classification as an Fe II nova: ATel #18008, ATel #18012
- Maximum and rapid evolution: ATel #18021 (Asiago), ATel #18022
- X-ray observation, t2 and t3: ATel #18028 (NuSTAR)
- Photometry and spectra from the University Observatory Jena: ATel #18033
- Neighbour stars: Gaia DR3 (Gaia Collaboration 2022); data of other observers: AAVSO International Database
- Nebular phase with strong [O III] emission: ATel #18090
- Spectroscopic monitoring (ARAS): ATel #18053
Another nova I followed this summer is Nova V2104 Aql. The recurrent nova T Coronae Borealis is still waiting for its next outburst.